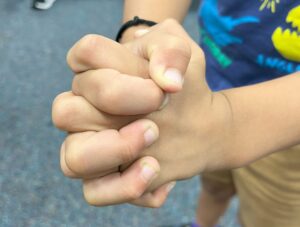
 Did you ever notice that when you clasp your hands, you always cross the same thumb over the top? It feels totally weird to go the other way. And guess what: it has nothing to do with being righty or lefty. If you don’t believe us, poll your friends and family!
That was one Party Fun Fact kids learned. They also learned about other dominant and recessive traits, including eye color. But where’s the math? The kids plotted THEMSELVES as data points on different charts!
- We made a bar chart showing kids’ birthdays by season
- We stood in a 2 x 2 matrix based on left- or righthandedness and left- or right-thumb-crossedoverness.
- We made a Venn diagram showing overlaps between kids with dimples, with widow’s peaks, and with brown eyes.
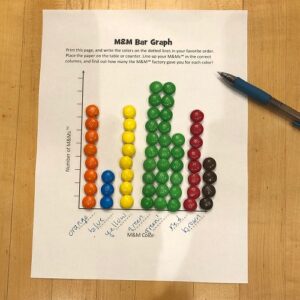 A bar chart is an easy way to introduce kids to data, maxima and minima, and averages. Keep the fun going with M&M Madness. Simply line up the candies by color, and poof, you have a bar chart. Try it with other colorful candies, cereals, pasta shapes, Lego – anything small and colorful will work!
Click here to download printable instructions and our ready-to-use bar graph.
To keep the Venn diagram fun going – and satisfy your sweet tooth – check out our Bedtime Math problem, The Tasty Truth About Those Treats!